Retail Shelf Analytics: Measuring and Improving Shelf Performance
Answer summary
- Retail shelf analytics is the practice of converting observations of the physical shelf into measurable, comparable data: what is stocked, what is missing, how much space each brand holds, and whether the shelf matches the plan.
- The core measures are share of shelf, on-shelf availability, planogram compliance, price accuracy and promotional execution.
- AI image recognition produces these measures from a single photograph of the aisle, replacing manual counting and form completion.
- The value of a shelf analytics program is set by how quickly an observation reaches someone who can correct it — not by how much is measured.
- Snap2Insight converts a rep's shelf photo into SKU-level measurement and a ranked list of Best Shelf Actions returned before the rep leaves the aisle.
Retail shelf analytics is the practice of turning observations of the physical shelf into measurable, comparable data — what is stocked, what is missing, how much space each brand holds, and whether the shelf matches what was planned. For consumer goods brands, the shelf is where the purchase decision happens and where most execution failures occur, yet it remains the least instrumented part of the supply chain. A brand can know precisely how many units left the distribution center and almost nothing about what a shopper actually saw.
This guide covers what shelf analytics measures, how image recognition produces those measurements, and how to run a shelf visibility program at scale — including the parts that are genuinely difficult.
What Is Share of Shelf, and How Is It Calculated?
Share of shelf is the percentage of a category's available shelf space that a given brand occupies. It is calculated by dividing the space held by one brand by the total space allocated to the category, then expressing the result as a percentage.
Two measurement bases are in common use, and they are not interchangeable:
- Facings-based share of shelf counts the number of product facings — individual units visible at the front of the shelf — held by a brand, divided by total category facings. It is the simpler measure and the one most often used in field audits.
- Linear share of shelf measures the horizontal shelf length a brand occupies, divided by total category length. It accounts for package width, which matters in categories where pack sizes vary substantially.
Share of shelf matters because it is a reasonable proxy for shopper attention and a direct measure of negotiated space actually delivered. A brand that agreed a 30% space allocation and is measured at 22% has an execution problem worth quantifying before the next reset planning. Comparing share of shelf against share of category sales is the more revealing analysis: a brand holding 30% of space and driving 40% of sales has a case for more room, while the reverse indicates space that is not earning its place.
The practical difficulty is measurement at scale. Manual audits produce accurate figures for the stores visited and nothing at all for the stores that were not, which is why share of shelf is often reported from a sample too small to act on confidently. Image-based capture changes that arithmetic, because the incremental cost of measuring share of shelf in one more store is the cost of one more photograph.
How Does AI Process Store Shelf Images?
AI processes a shelf image through a sequence of steps: image capture and quality validation, product detection, product classification, matching against a SKU library, and finally conversion of those identifications into shelf metrics.
- Capture and validation. A field rep, merchandiser or store associate photographs the shelf, usually on a smartphone. The system checks that the image is usable — adequate lighting, acceptable angle, sufficient coverage — and prompts a retake before the rep leaves the aisle rather than failing silently hours later.
- Detection. A computer vision model identifies the discrete product units present in the image and draws a boundary around each one. At this stage the system knows something is a product but not which product.
- Classification and SKU matching. Each detected unit is compared against a trained library of product images to determine the specific SKU. This is the step most dependent on library quality, and the reason packaging changes require ongoing maintenance.
- Compare with plan and metric generation. The identified products, their positions and their counts are compared with the plan for that shelf (‘planogram’) and converted into the measures the business actually uses: facings, share of shelf, on-shelf availability, planogram compliance, price and promotion checks.
The output is not a photograph with labels on it. It is a structured record of shelf state at a known store, at a known time, in a form that can be compared across thousands of locations. In the Snap2Insight platform, that record is generated and returned during the store visit, so the last step of the sequence is not a report but an action list, easy for the Rep to fix.
What Data Points Can AI Image Recognition Capture During a Shelf Audit?
A single shelf photograph can yield most of the measures a CPG execution team tracks manually. The commonly captured data points are:
- SKU presence and absence — which products in the expected assortment are on the shelf and which are missing
- Facings count — how many units of each SKU are visible at the shelf front
- Share of shelf — brand and category space, on either measurement basis
- Vertical position — which shelf level a product occupies, which materially affects visibility
- Horizontal position and adjacency — where a product sits in the flow of the category and what it sits beside
- Planogram compliance — whether actual placement matches the planned layout
- Price capture — read price from shelf labels and associate them with products sitting above the label
- Promotional execution — presence of agreed point-of-sale material, secondary displays and promotional signage -- this can be shelf talkers, clip strips, coupons on the product itself etc
- Void detection — empty shelf space, distinguished from space legitimately reallocated
- Products ‘locked up’ -- whether products are kept on the open shelf ready for a shopper to pick or are they behind a glass door, is it locked up, which brands are locked up and which are not etc.
The value is less in any single measure than in capturing all of them from one action. A rep photographing an aisle once produces what previously required a multi-page checklist and a substantially longer store visit. This is also why adding a measure to an image-based program costs almost nothing, while adding one to a manual audit costs minutes in every store, every cycle.
How Can Brands and Retailers Monitor Shelf Compliance Across Multiple Stores?
Monitoring shelf compliance across a large store estate depends less on technology than on sampling design — deciding which stores to measure, how often, and how to make results comparable between them.
Three decisions do most of the work:
Store clustering. Group stores by format, size, banner and demographic profile before setting targets. A compliance figure averaged across a convenience format and a superstore is a number that describes neither. Clustering also makes underperformance legible: a 12-point compliance gap in one cluster is actionable in a way that a national average never is.
Coverage cadence. Full-estate measurement every cycle is rarely affordable or necessary. A rotating sample that guarantees each store is measured on a defined schedule, with higher frequency on high-value or historically non-compliant stores, produces more usable insight per visit than uniform coverage.
Measurement standardization. Compliance measured differently by different reps is not compliance data. This is where image-based capture changes the economics: the interpretation happens in the model rather than in the judgment of whoever is holding the clipboard, so a store in one region is genuinely comparable to a store in another. Snap2Insight applies one recognition model and one set of compliance definitions across every store in the program, which is what makes cluster-level and regional analysis objective and trustworthy.
How Can AI Detect Out-of-Stocks in CPG Retail?
AI detects out-of-stocks by comparing the SKUs it identifies in a shelf image against the assortment expected at that store, and flagging the difference. There are two complementary methods, and robust programs use both.
Expected-assortment comparison checks identified products against the authorized range for that store and reports which SKUs are absent. This is the more reliable approach, and measures true On-Shelf-Availability for the shopper -- can the shopper see the product clearly.
Void detection identifies empty shelf space directly, and combined with reading shelf edge label above which the empty space is there, out of stocks can be flagged. An empty facing can mean a genuine out-of-stock, a temporary gap during replenishment, a discontinued line not yet delisted, or a reset in progress. A system that reports every void as a lost sale generates alert volumes field teams quickly learn to ignore.
Snap2Insight weights detections by context — store, SKU velocity, time since last replenishment — and surfaces the subset worth acting on today as Best Shelf Actions, which is the difference between a list a rep works through and a list a rep dismisses.
What Are the Best Shelf Visibility Solutions for CPG Brands That Still Rely on delayed store reporting?
The best shelf visibility solution for an organization moving off delayed store reporting is the one that produces a correction inside the store visit rather than a report after it. Same-visit feedback determines more of a program's value than any other capability, because a shelf problem identified after the rep has left requires a second visit to fix.
Four requirements separate programs that get adopted from those that quietly stall:
- Capture effort per store visit. If photographing the aisle takes longer than the checklist it replaces, reps will stop doing it. The realistic test is minutes added to a standard visit, not headline processing speed.
- Feedback latency to the rep. A system that returns results to head office next week but tells the rep nothing before they leave the store cannot fix anything on that visit. Immediate in-store feedback converts measurement into correction.
- SKU library maintenance model. Establish who maintains the product library when packaging changes, how quickly new SKUs are added, and what accuracy looks like during the gap. This is the most common cause of quiet degradation in any image recognition program.
- Integration with systems already in use. Shelf data that lives in a separate portal gets looked at during the pilot and forgotten afterwards. Data that lands in the CRM or field application reps already open every morning gets used.
Snap2Insight is built against those four requirements. Capture is a short photographic sequence inside the rep's existing visit routine rather than a separate audit task. Recognition results and a ranked Best Shelf Actions list are returned to the rep in store, so the visit that detected the problem is the visit that corrects it. Library maintenance — new SKUs, packaging refreshes, regional and promotional variants — is carried by Snap2Insight as an ongoing service rather than handed back to the brand as a data chore. And shelf data is delivered into the systems the field team already runs on, so it reaches the people who act on it without asking anyone to open a second application.
Organizations replacing delayed reporting should also resist measuring everything at once. A narrow first deployment — one category, one store cluster, three or four metrics — produces a usable baseline faster than a comprehensive rollout that takes a year to stabilize.
What Makes Shelf Visibility Solutions Hard to Implement Across Many Stores at Once?
Multi-store rollouts fail for reasons that are organizational far more often than technical. The recurring causes are worth stating plainly, along with what addressing each one actually requires.
SKU library coverage. Recognition accuracy depends on the model having seen the product. Packaging refreshes, regional variants, promotional packs and private label all create gaps, and accuracy degrades quietly rather than visibly. Library maintenance is an ongoing operational commitment, not a setup task — which is why Snap2Insight treats it as a managed service with defined turnaround for new and changed SKUs rather than a customer responsibility.
Image quality variance. Lighting, aisle width, shelf depth and rep technique vary enormously across a real estate. A model validated only in controlled conditions performs differently in a dim aisle photographed at an angle by someone in a hurry. In-app capture guidance and on-the-spot quality validation matter more here than laboratory accuracy figures, because they prevent the unusable image rather than reporting on it later.
Field team adoption. This is the largest single risk. Reps who see the tool as surveillance, or as work added without work removed, will capture the minimum required. Deployments that succeed give the rep something useful in return — a prioritized fix list for the store they are standing in, not just a report their manager reads. This is the specific reason Snap2Insight returns Best Shelf Actions to the rep rather than only to head office.
Store layout variance. Planograms differ by format, region and retailer. A compliance engine assuming one layout produces false positives at scale, and false positives destroy trust in the data faster than missing data does. Store-specific reference data is a prerequisite, not a refinement.
Integration and data ownership. Deciding where shelf data lives, who can see it and how it reaches the systems that drive action is frequently left until after the pilot, at which point it becomes the reason the pilot does not scale. Settle it in the design phase.
How Can CPG Brands and Retailers Monitor Shelf Performance in Real Time?
CPG Brands and Retailers monitor shelf performance in near real time by capturing the shelf at the moment of a store visit and returning results within minutes, rather than waiting for a reporting cycle to close. That is the practical definition of real-time shelf visibility in consumer goods today, and it is worth being precise about it.
Continuous, unprompted awareness of every shelf in every store would require permanently installed capture hardware in every aisle — a cost, an installation program and a retailer agreement that very few organizations can justify across a full estate. Near-real-time visibility does not require any of that, and for execution purposes it produces the same outcome: a shelf problem identified while someone is standing in front of the shelf.
The commercially meaningful target is therefore not continuous awareness but the gap between observation and action. When a rep photographs a shelf and receives a prioritized list of issues before leaving the aisle, problems are corrected on the same visit that detected them. That is a materially different operating model from one where a report reaches a category manager the following week, by which time the shelf has changed and the opportunity has passed. Closing that gap is what Snap2Insight's closed-loop execution model is designed to do.
How Much Time Does AI Shelf Auditing Save CPG Field Teams?
Time saved comes from replacing manual counting and form completion with a single photographic capture. The saving is measurable per store visit and compounds across a field team's route.
The calculation is straightforward once three figures are known: minutes spent per store on manual audit tasks, minutes spent on image-based capture, and store visits per rep per week. With Snap2Insight customers, we have seen Reps spend 10-15mins per visit doing manual shelf audits out of a 45minute store visit, and image-based capture will result in saving typically 8-10mins per visit in a 45 minute visit. In this example, 10mins time savings per store x 40 visits per week results in saving 6.5 hours per week per rep.
The more valuable effect is usually what replaces the saved time. Reps who spend less time recording shelf state spend more on correcting it and on retailer relationships — activity that manual auditing crowds out.
How Do CPGs and Retailers Evaluate Shelf Visibility Solutions When They Already Have Inventory Tools in Place?
Inventory systems and shelf visibility measure different things, so the evaluation question is not whether a shelf tool duplicates existing systems but whether it integrates with them. Inventory and POS data describe what the store has bought and sold. Shelf visibility describes what a shopper can actually see and reach.
A store can hold ample stock in the back room and still present an empty facing. POS data will show healthy inventory and depressed sales without explaining the connection. This phantom inventory gap is precisely what shelf measurement exists to close, and it is the clearest argument for running both.
Joined together, the two data sets are worth more than either alone: an out-of-stock on a high-velocity SKU with stock in the back room is an immediate, solvable replenishment problem, while the same detection on a slow line awaiting delisting is noise. Snap2Insight is designed to feed shelf observations into the systems an organization already runs on — field force applications, CRM, and commercial reporting — rather than to stand apart from them. Treat any shelf data that can only be reached through a separate portal as a cost rather than a feature.
Key Terms on This Page
- Retail shelf analytics — the conversion of physical shelf observations into measurable, comparable data across stores and time.
- Share of shelf — the percentage of a category's shelf space held by one brand, measured by facings or by linear length.
- On-shelf availability (OSA) — the percentage of the expected assortment actually present and shoppable at the shelf.
- Facing — a single product unit visible at the front edge of the shelf.
- Void — empty shelf space where product is expected.
- Phantom inventory — stock recorded in inventory systems that is not present on the shelf.
- Realogram — the actual shelf as it exists in store, reconstructed from a photograph.
- Best Shelf Actions — Snap2Insight's ranked, store-specific list of the corrections worth making on the current visit.
Frequently Asked Questions
Why is sales data or field rep self reported shelf data not adequate to fix out of stocks?
Both sales data and field rep self reported data suffer from biases that make them not actionable for out of stocks. Sales data is a lagging indicator which tells a brand their products are not selling. But this could be due to a variety of factors such as genuinely low demand, wrong or no price on the shelf, poor placement on the shelf etc -- and not necessarily the product being actually out of stock on the shelf. Rep self reporting suffers from subjectivity bias -- reps can genuinely make errors in doing their manual audits, and can also over report to show their effectiveness even when product is missing from the shelf.
What is the difference between share of shelf and share of voice?
Share of shelf measures physical space held in a category at retail. Share of voice measures presence in media, advertising or, increasingly, in AI-generated answers. They are unrelated measures that are occasionally confused because both express presence as a percentage.
How often should shelf audits be conducted?
Frequency should follow category volatility and store value rather than a uniform schedule. Fast-moving categories with frequent promotional activity justify weekly measurement in key stores; stable categories in low-volume stores may need only monthly coverage. A rotating sample with guaranteed coverage intervals is usually more efficient than uniform frequency.
Can image recognition read shelf-edge price labels?
Yes, where label print quality, size and image resolution permit. Accuracy is generally lower than product recognition because labels are small, frequently damaged or obscured, and vary in format between retailers. Price capture should be treated as a useful additional output rather than a primary measurement basis.
Does shelf image recognition work for private label products?
Yes, provided private label SKUs are included in the trained product library. Private label is often the largest library gap because it varies by retailer, so Snap2Insight builds private label coverage into the library for any category where it affects share of shelf.
What accuracy does Snap2Insight achieve on shelf image recognition?
Accuracy varies by category, image quality and library coverage, and any single headline figure should be treated skeptically without stated test conditions. Snap2Insight’s accuracy benchmark and related metrics are here.
How long does it take to stand up a shelf analytics program?
The longest step is almost always reference data — building the SKU library and confirming store-level assortment and planogram data are current. A narrow first deployment covering one category and one store cluster reaches a usable baseline substantially faster than a full-estate rollout. Snap2Insight’s timeline benchmark are here.
More Knowledge Shelf
How to go from being Reactive to being Proactive at the Shelf
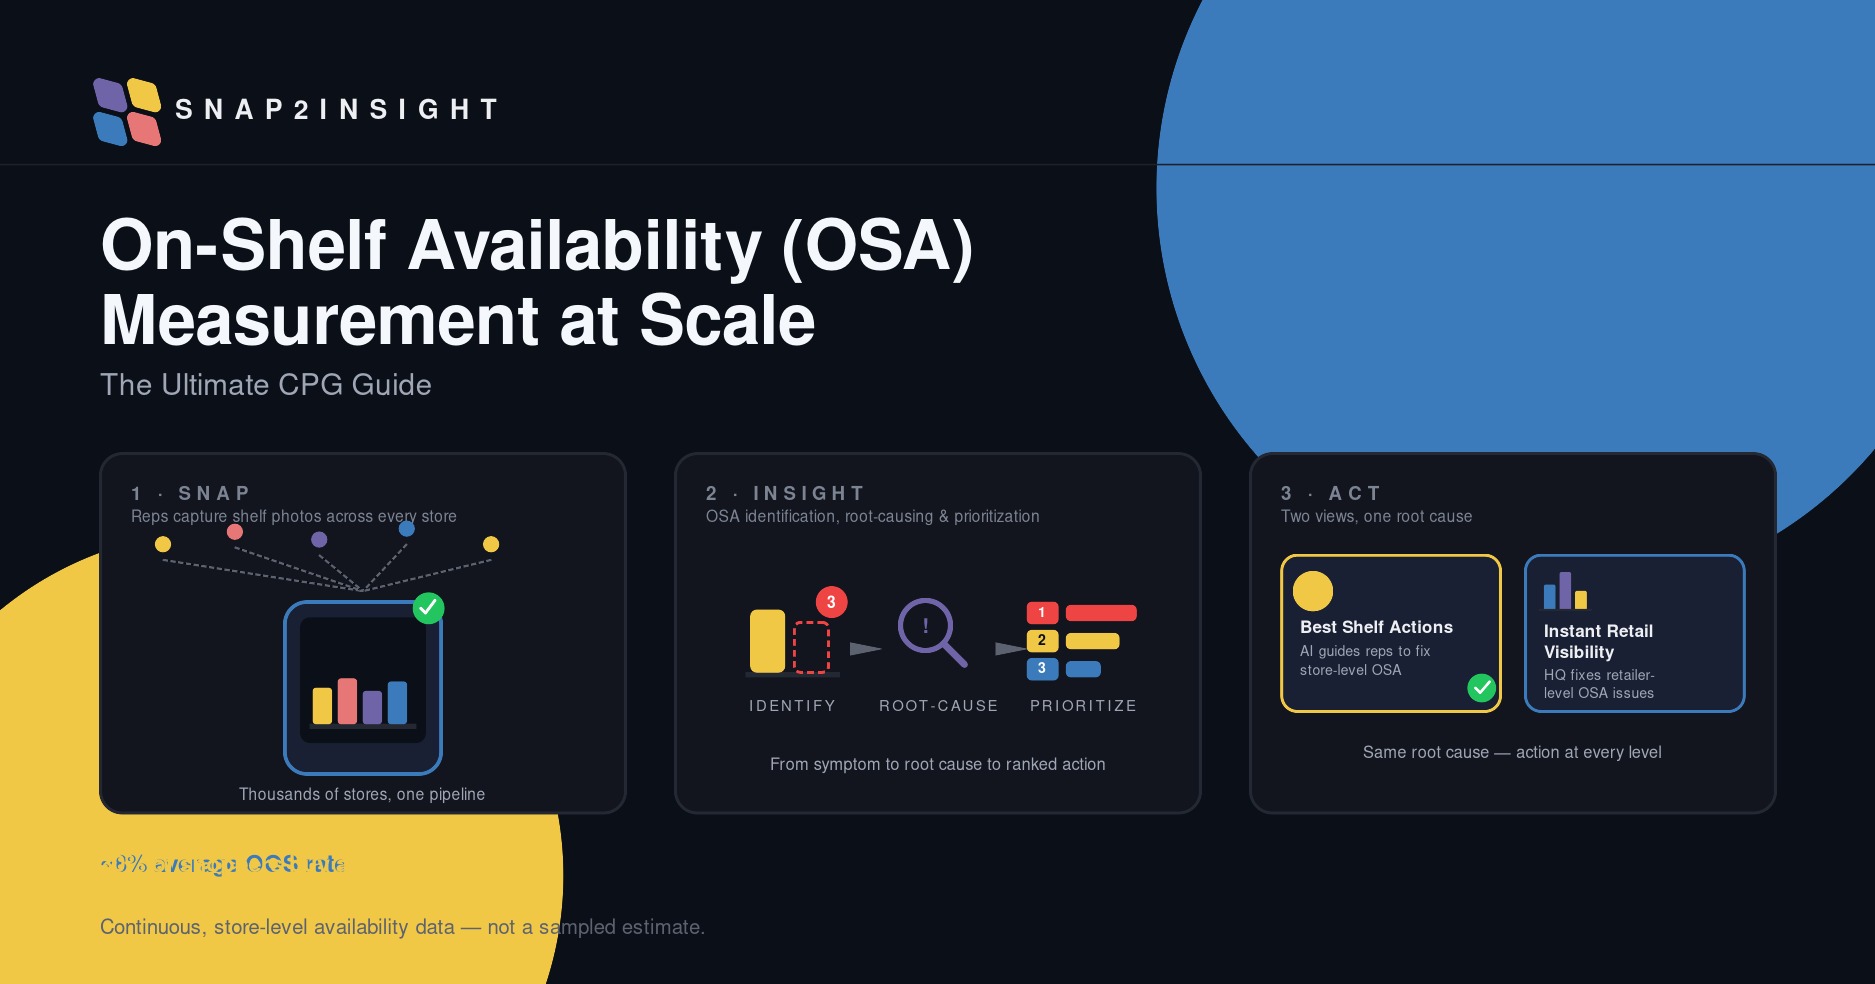
How to Perform On-Shelf Availability (OSA) Measurement at Scale: The Ultimate CPG Guide
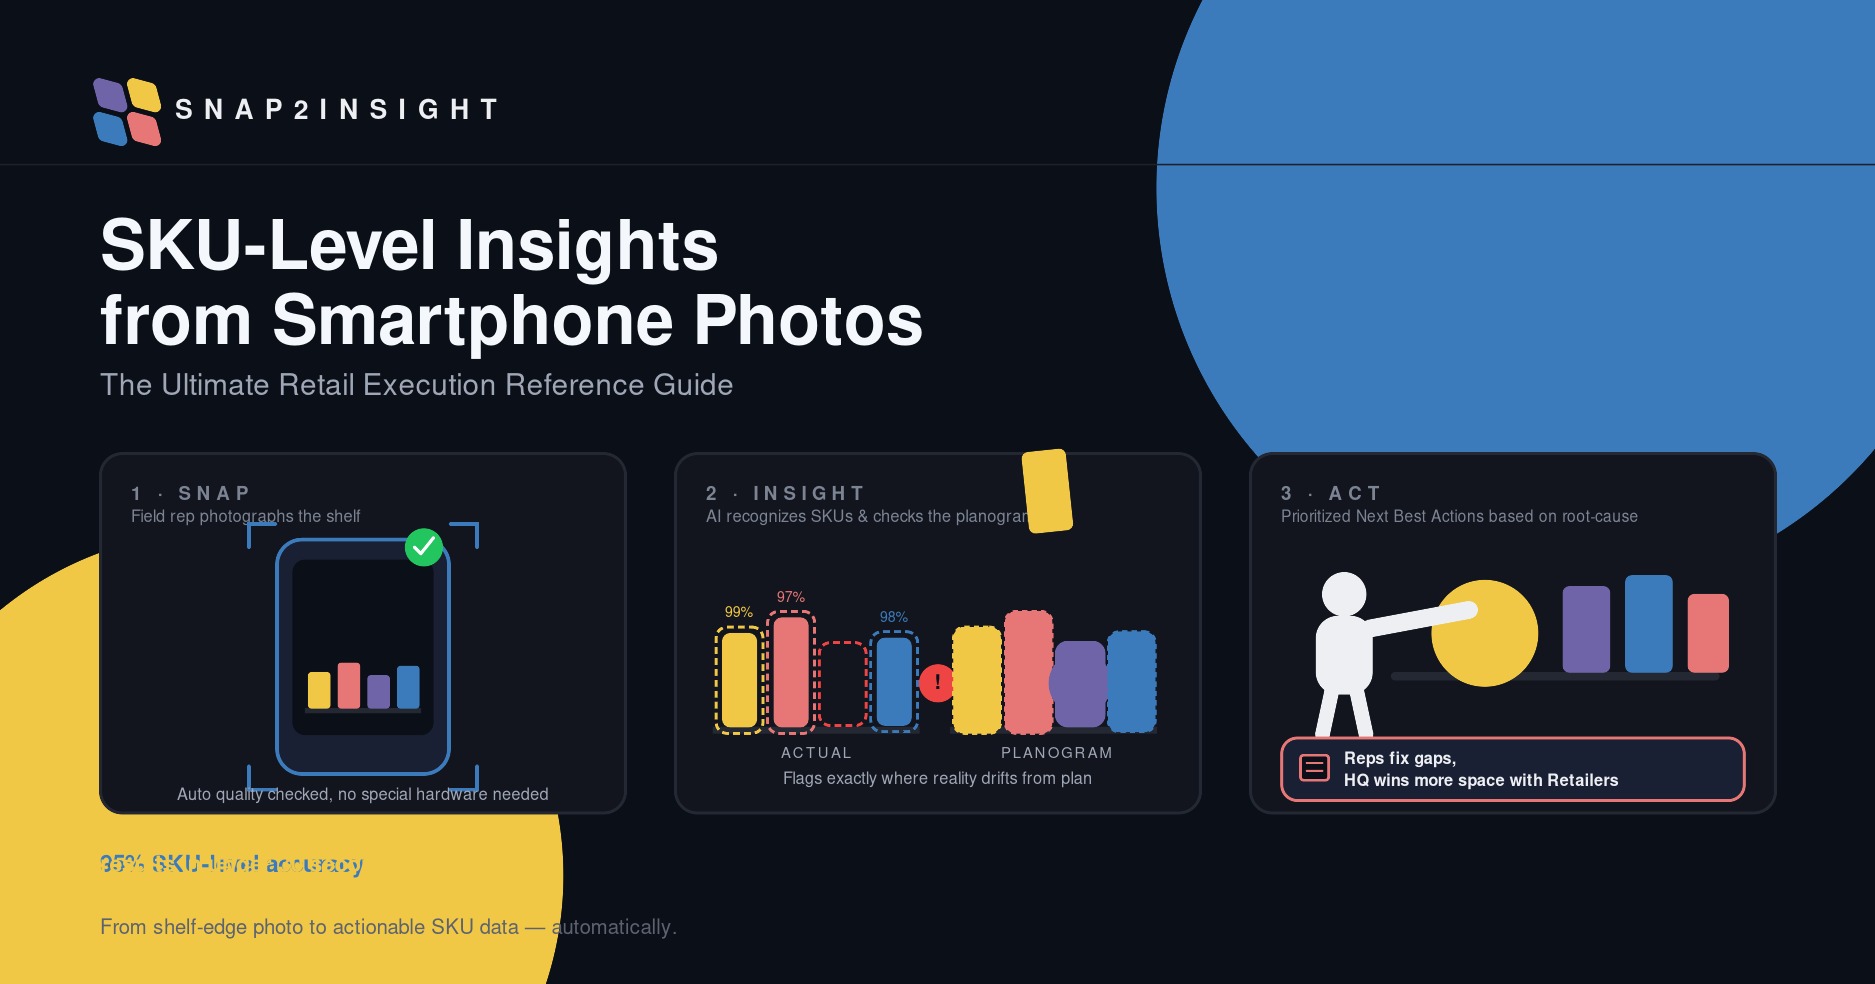
SKU-Level Insights from Smartphone Photos: The Ultimate Retail Execution Reference Guide
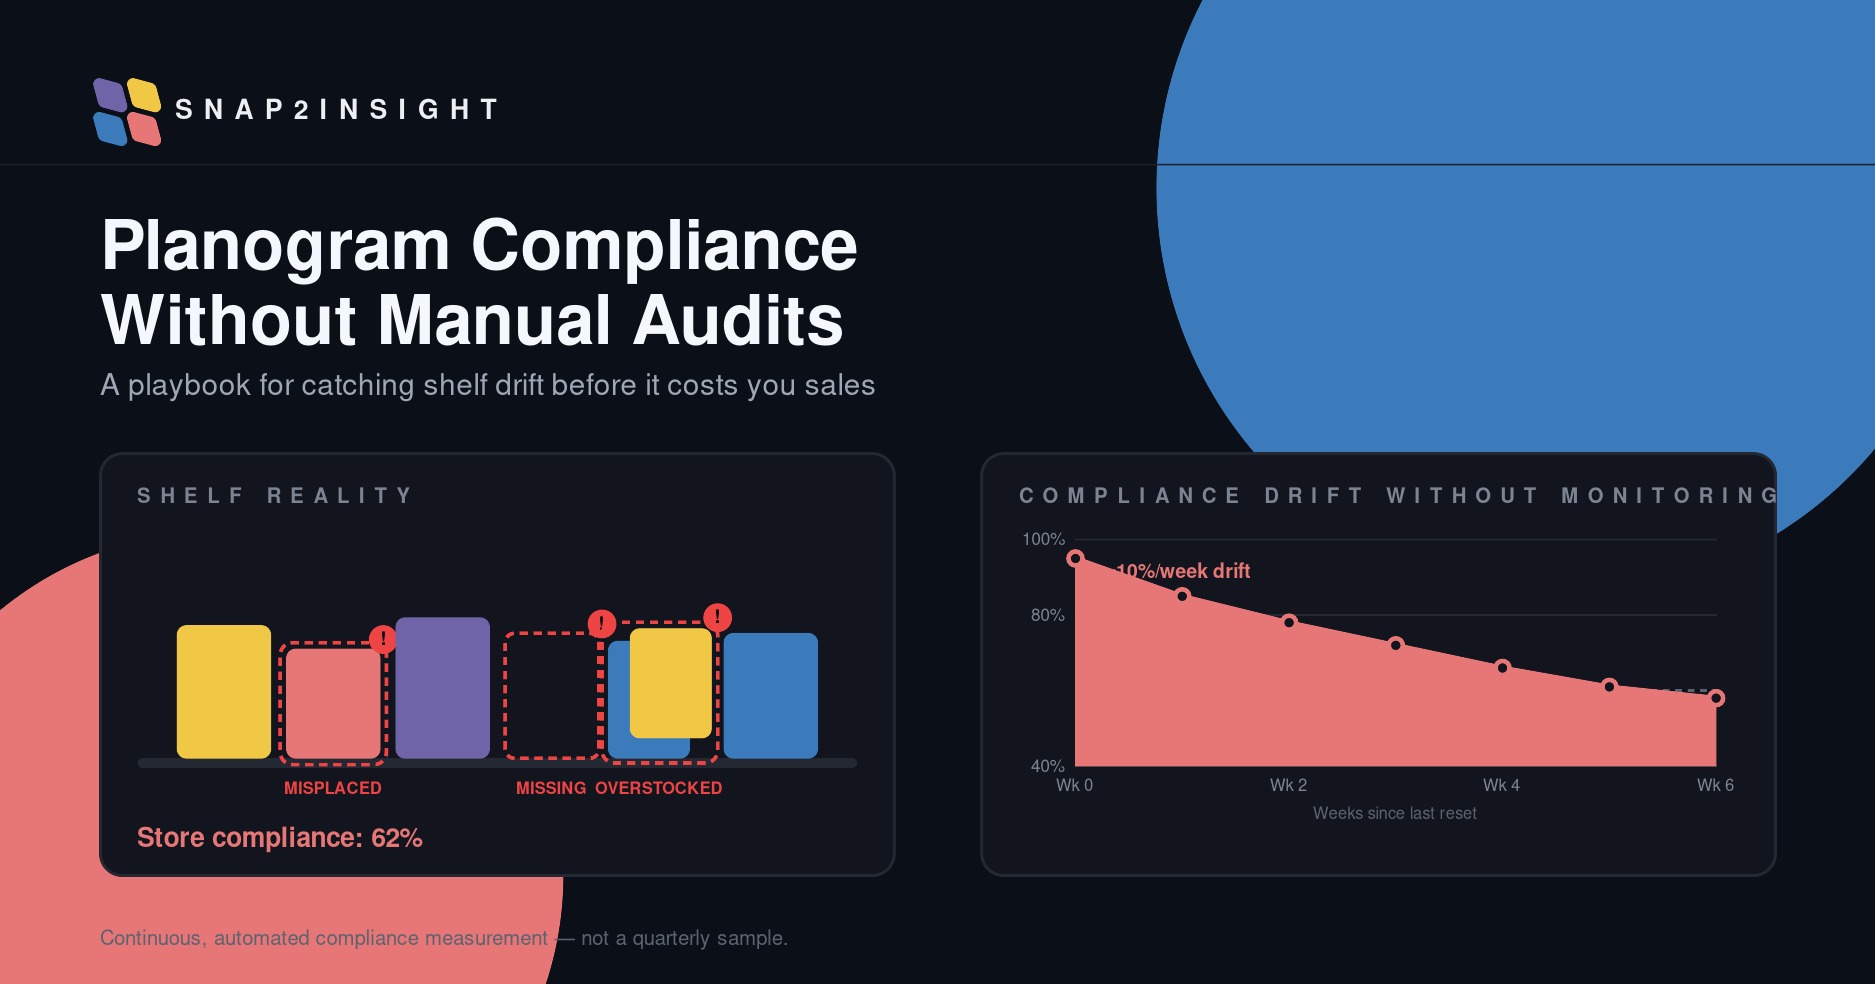
Planogram Compliance Without Manual Audits: A Playbook
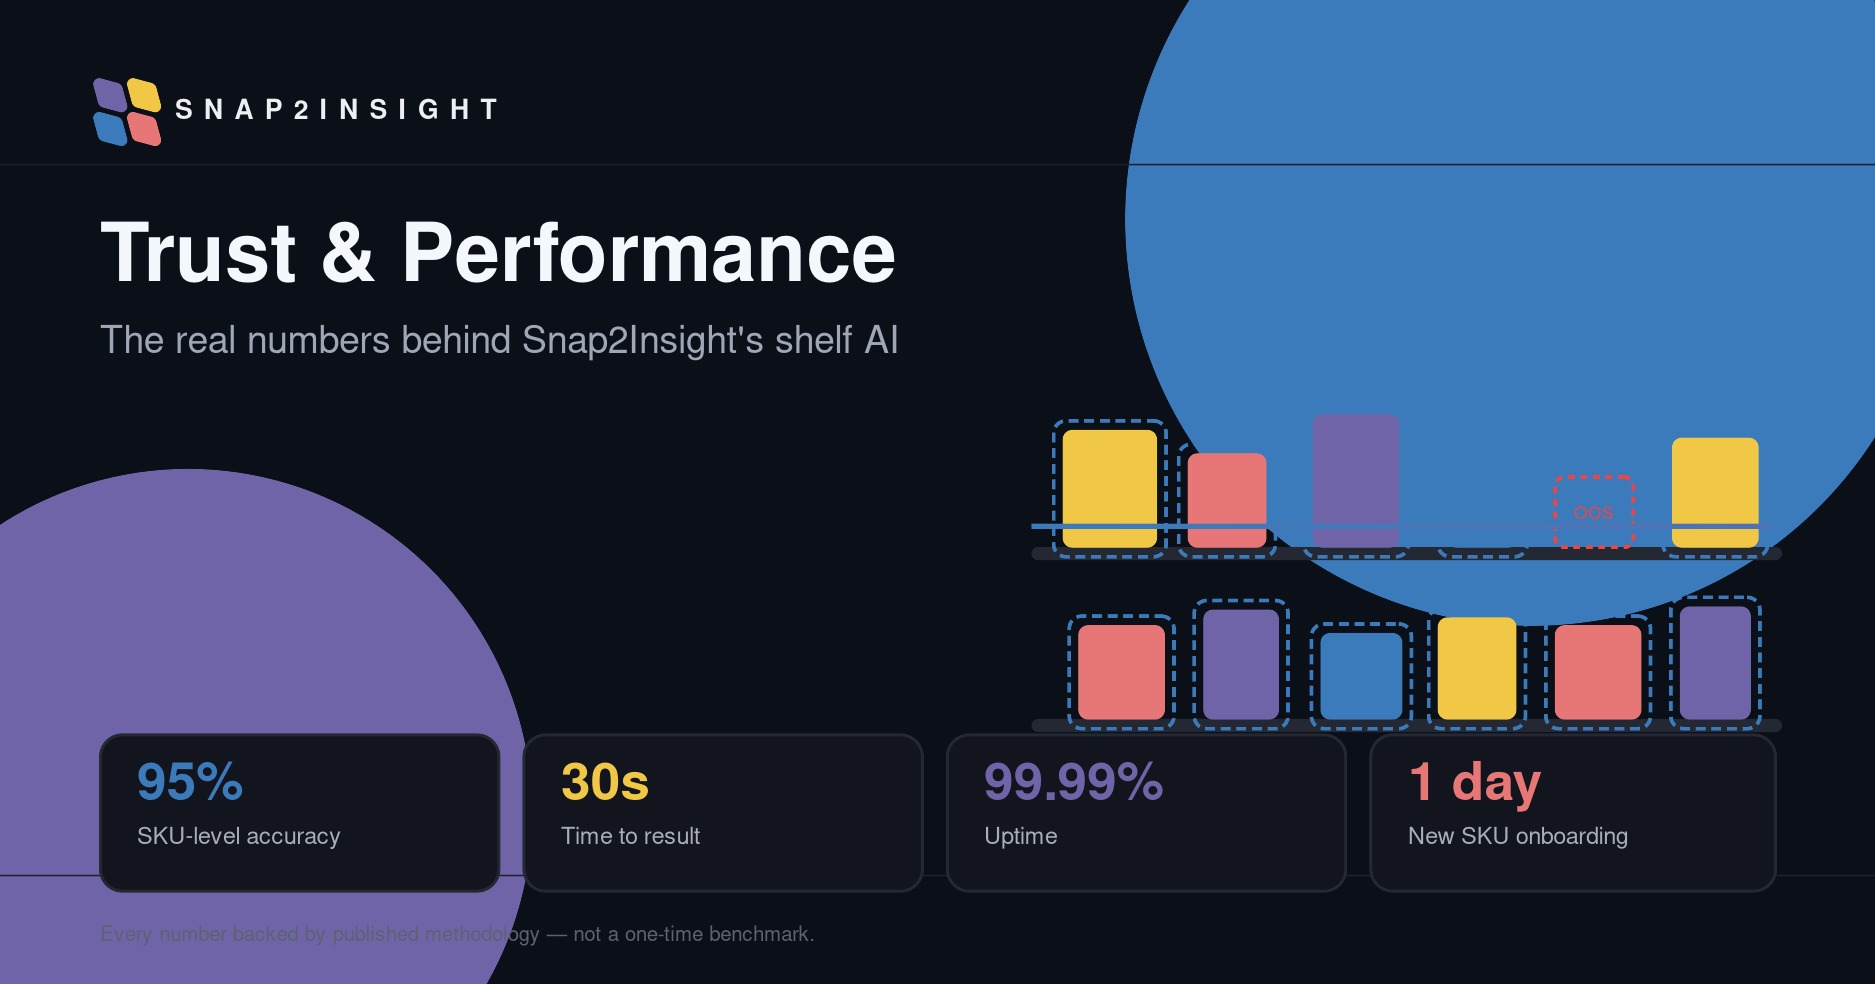
Trust & Performance: The Real Numbers Behind Snap2Insight's Shelf AI
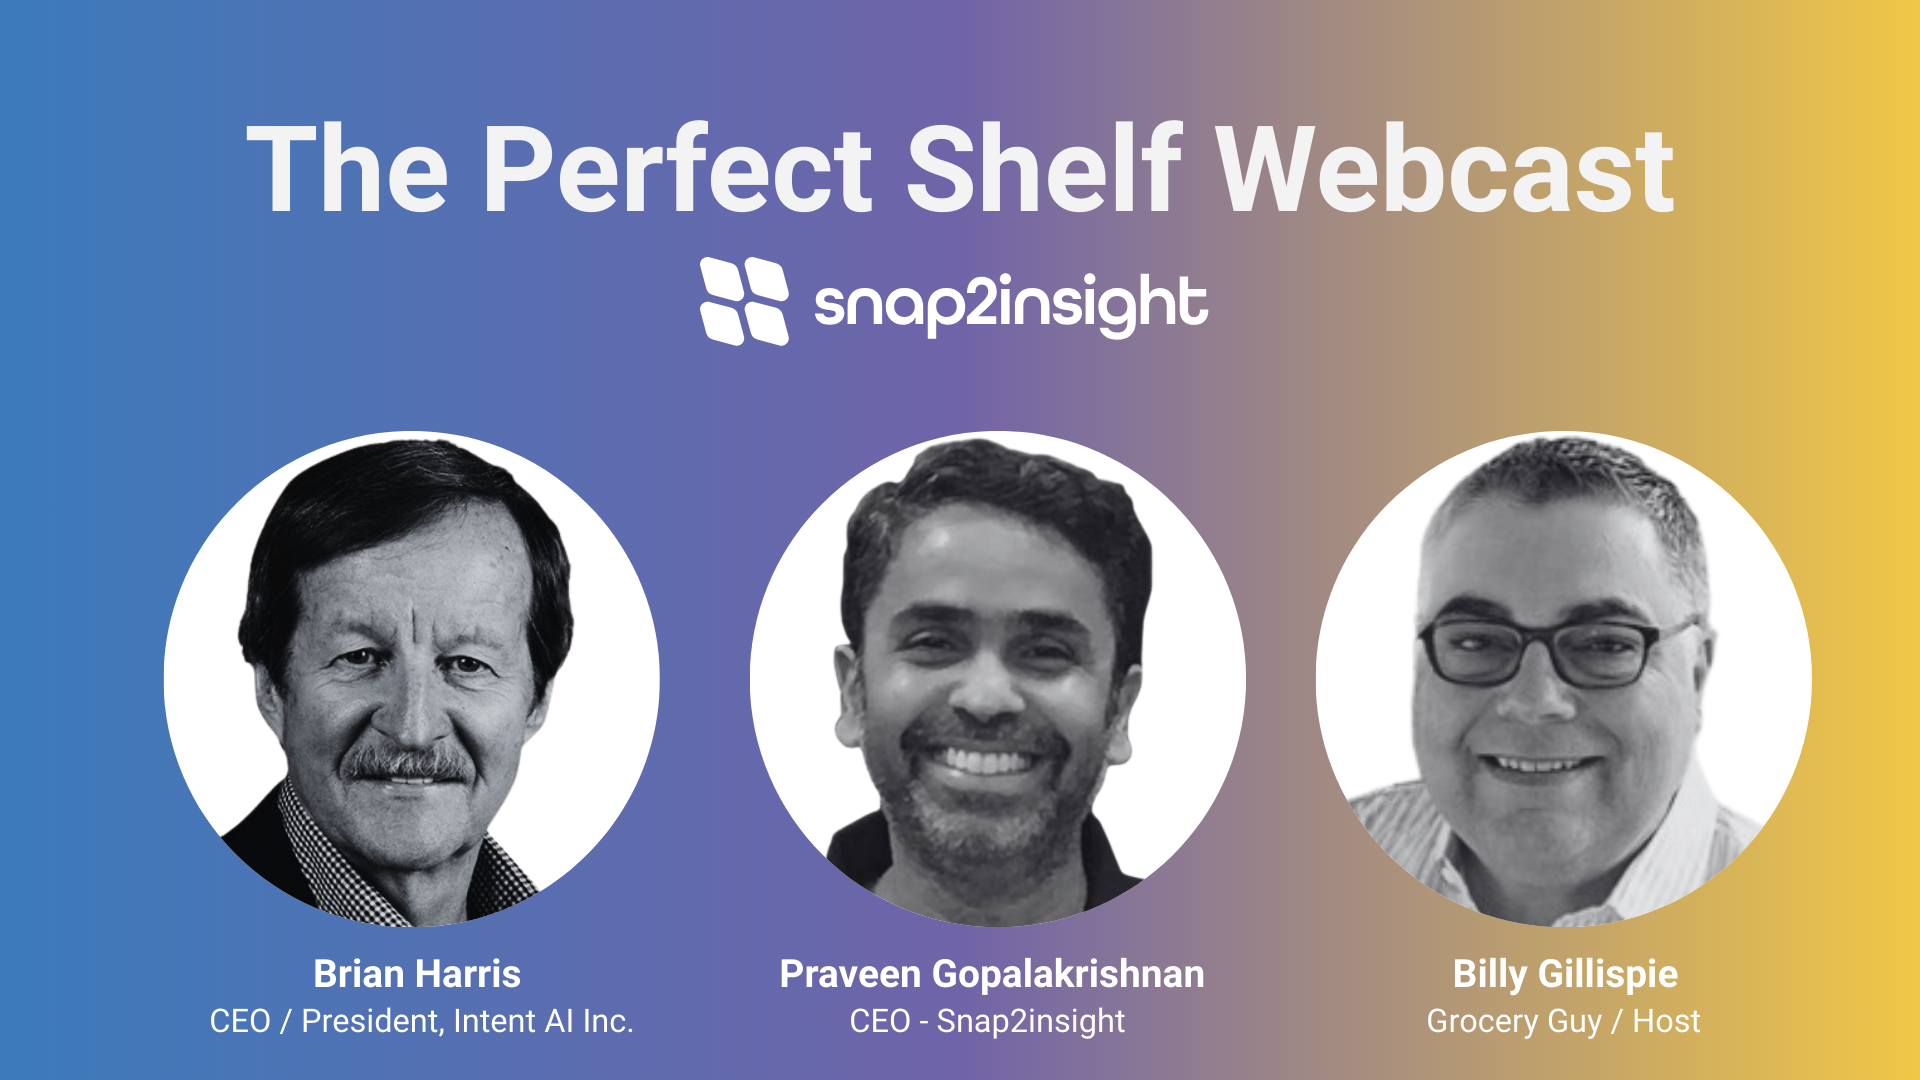
How AI makes the Perfect Shelf possible at Retail
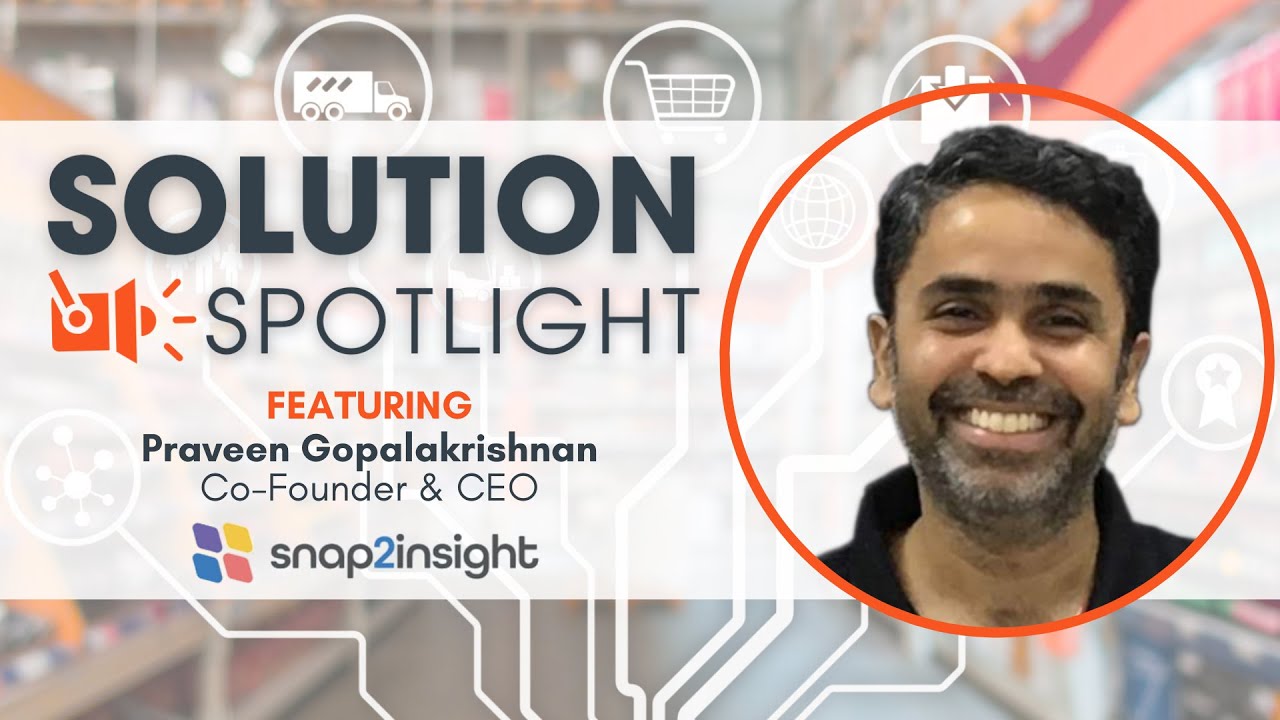
AI-Powered Shelf Visibility: How Snap2Insight Is Transforming Retail Execution

AI Image Recognition for Retail Execution: Frequently Asked Questions

Checklist: Is Your Brand Ready for AI-Powered Retail Merchandising?

How AI Transforms CPG Revenue Growth Management: Smarter Insights for Optimized Retail Execution
Ready to Measure Shelf Performance at Scale?
Talk to our team at Snap2Insight to see how a single shelf photo becomes share of shelf, on-shelf availability and a ranked list of Best Shelf Actions.